Building Hydrographic Intelligence from Fragmented Datasets - The Lagos OMI-EKO Experience - Act One

The year was 2017, and the Lagos waterways was an opaque system. Glaring dearth of data, zero trust in the system, and a legal tussle. But it took the vision of a team to turn its fortunes around..
Act 1 - The Void
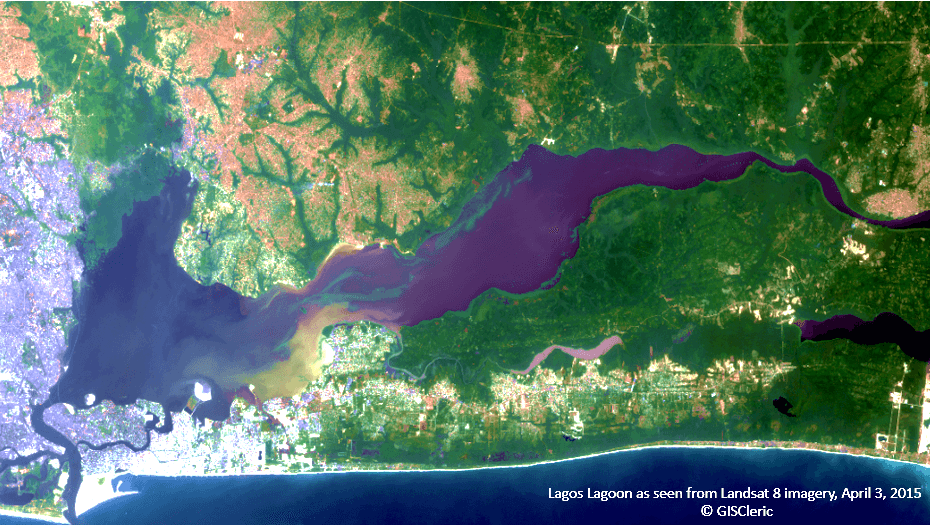
Lagos is, at its core, a water city. Stand at the edge of the lagoon on a clear morning and the scale of this becomes inescapable. The Lagos Lagoon stretches across 869.59 square kilometres; one of the largest inland water bodies in West Africa, covering roughly a fifth of the entire land area of Lagos State. It connects almost every major inland town: Ikorodu to the north, Badagry to the west, Epe and Lekki to the east. It is older than the city that grew around it. In many ways, it is the city's original infrastructure.
“"The failure was not one of observation. It was one of systematisation. Lagos waterways were not truly unknown — they were unreadable."”
And yet, for most of the modern city's planning life, the lagoon was informationally absent.
This is not the same as saying it was unknown. Twenty million people live in Lagos - a population growing at more than three percent per year; and a meaningful fraction of them interact with the waterways every day. Fishermen, ferry operators, freight handlers, and the daily minimum of two thousand commuters who cross the lagoon each morning carry real knowledge of its conditions, its hazards, its seasonal rhythms. The water was observed, continuously, by people whose livelihoods depended on reading it correctly.

But none of that observation was recorded in a form that planners could use. The knowledge was tacit, distributed, and invisible to the instruments of urban governance. When anyone in Lagos State asked the most basic questions :- how deep is the channel here, can this vessel class use this route year-round, what happens to passenger volumes when a parallel road is blocked; there were no systematic answers. The data existed, in a sense, but it was fragmented across agencies, siloed within departments, formatted in ways that resisted integration, and never translated into the decision-grade intelligence that infrastructure investment requires.
The failure was not one of observation. It was one of systematisation. Lagos waterways were not truly unknown, they were unreadable.
Imagine standing at a jetty, say, Ilaje in Bariga, on the northern edge of the Lagos Lagoon. Ferries arrive and depart. Passengers embark, sometimes wait, sometimes turn back. The operator of the vessel knows something about the water depth on his route, though this knowledge is years old and was passed on verbally. The jetty structure has not been assessed in any documented way. The number of passengers who crossed here last month exists only in rough mental estimates. The road conditions three hundred metres away, which drive or suppress demand for the water route, are tracked by a different agency entirely, in a different data format, shared with no one. Every element of this interaction; the vessels, routes, passengers, infrastructure, access is informationally orphaned.
This was the condition of Lagos waterways at the start of 2018. Not ruined. Not neglected, exactly. But unreadable. And unreadable systems cannot attract investment, cannot support planning, and cannot be transformed.

ACT TWO — THE FIRST SIGNALS (2018–2019)
OEA Consults Ltd — Observatory Earth Analytics entered this landscape through a specific door. The firm's founding proposition was geospatial intelligence: the use of satellite imagery, remote sensing, and spatial analytics to answer questions that ground-level observation alone cannot. The tagline was precise and ambitious: "Redefining development using geospatial technologies."
In 2018, OEA approached the Lagos State Waterways Authority with a proposal centred on drone and UAV capabilities. The pitch was framed around safety: unmanned aerial vehicles could monitor vessel movements, document jetty conditions, provide visual intelligence for incident response. Safety was a credible entry point. It was operationally relevant, politically legible, and technically demonstrable. A drone is visible. It produces images that officials can look at. It creates a deliverable.

But the deeper ambition was different. Safety surveillance was not where the work was leading. What OEA was beginning to sketch, in a language that would take several years to fully articulate, was an evidence architecture. A systematic, connected, continuously updated body of intelligence about a waterways system that had never been coherently documented.
The first structured expression of this ambition came in February 2019, with the LAGWIP proposal: the Lagos Waterways Geospatial Information Portal. The proposal posed four foundational questions that the Lagos waterways system could not then answer:
- What is the extent of navigable water?
- What are the depths across the network?
- Which routes are viable for which vessel classes?
- What is the realistic passenger potential across the system?
These are not complicated questions in theory. For a European or North American port authority, they would be answered by consulting existing hydrographic records. For Lagos Lagoon in 2019, they required a new survey from scratch.

The bathymetric mapping work began in earnest that year, and the final report was published in September 2019. The survey covered fifteen complementary routes across the Lagos waterways network; not a sample, but a structured coverage designed to support route-level decision-making. The technical methodology was unusual and, at the time, genuinely advanced: rather than relying solely on single-beam or multi-beam sonar surveys (expensive, slow, and logistically difficult across a lagoon of this scale), OEA applied machine learning algorithms to satellite imagery, using Support Vector Machines, Artificial Neural Networks, and Random Forest classifiers to derive depth from spectral data and validated by a comprehensive inset data collected at a coarser scale. The accuracy achieved exceeded 88 percent. The outputs included bathymetric charts of Lagos Harbour and Five Cowries Creek, the first systematic depth maps of these corridors in the modern planning era.

The charts were not just data. They were the beginning of legibility.
To understand why this matters, consider what a bathymetric chart enables that simple observation cannot. It tells a port authority, a ferry operator, or an infrastructure investor: here is where vessels of a given draft can navigate at low tide. Here is where dredging would be required to open a new route. Here is where a sandbar has migrated since the last survey. The chart converts the water's depth — previously held only in the tacit knowledge of experienced operators — into a spatial record that persists beyond any individual, can be updated, shared, compared over time, and integrated with other data layers. It transforms the water from an operational environment into an informational one.
This is the moment when the work shifted from consultancy to architecture.
Part 2 of the article will talk more about how we moved from isolated projects to building patterns of discovery and explore what inadvertently became the birth of hydrographic intelligence on the Lagoon scale.
Enjoyed this?
Get future essays and field notes delivered direct. No spam.
Share this article
Also on
Category
HydrographicsReading time
15 min
Published
March 6, 2025
More Writing
Browse all articles