Building Hydrographic Intelligence from Fragmented Datasets - The Lagos OMI-EKO Experience - Act Two

if you were given one opportune to transform an opaque public infrastructure - Would you trial it out or follow the Lagos Waterways example.

How do you begin to make a hidden system legible? The question is harder than it sounds, because the institutional context in which the work must happen is rarely hospitable to slow, cumulative, evidence-building effort. Public agencies have mandate cycles, budget calendars, and political timelines. They are rewarded for visible outputs, bridges opened, vessels procured, routes launched, not for the patient construction of the evidence base that makes those outputs durable.
Evidence about a complex system does not accumulate uniformly. It accumulates in layers, and each layer changes what the next layer needs to ask.
if you missed the first part of the article, read it here
FROM PROJECTS TO PATTERNS
The bathymetric survey established the physical parameters of navigation: where the water was deep enough to be usable. But depth data alone says almost nothing about whether those routes are actually viable for transport investment. That requires a second layer: the governance and data management infrastructure to hold the information in an accessible, updatable form over time.

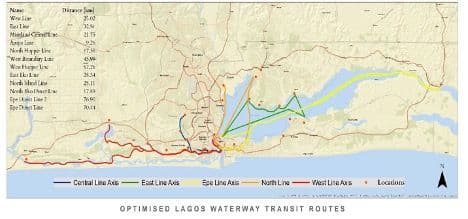
By October 2020, the work had expanded to address this problem directly. The Lagos Waterways Information and Data Management Centre framework , LAWMID covered twelve terminals across the network: Ilaje and Ijegun Egba in the north and centre, Five Cowries and Ebute Ero on Lagos Island, Liverpool and Sagbokoji to the west, Ipakodo and Badore to the east and south, and Gbajiyeke, Commando, and Ajido reaching the Badagry frontier in the west. What LAWMID proposed was not primarily new data collection. It was institutional architecture: naming conventions, update cycles, access protocols, quality assurance workflows. The insight driving it was unglamorous but important , datasets decay.
A bathymetric survey that is not refreshed as sedimentation patterns shift becomes misleading rather than merely stale. A jetty condition record that is never updated creates a false sense of known risk. Data governance is not a supporting function; it is part of the intelligence system itself.
In 2021, the work deepened further with the introduction of systems dynamics modelling into the analytical architecture. This was a qualitative shift in what the intelligence could do. Bathymetric data is essentially static: it tells you where you can go. Route intelligence is operational: it tells you how the system currently works. Systems dynamics is predictive: it asks what happens when something changes. What if a major road corridor in Apapa becomes impassable for six months? What does the downstream effect on waterways demand look like , and can existing jetty infrastructure absorb it? What if a new terminal is opened at Ode-Omi? How does that reshape passenger flows across the eastern lagoon? A planning system without predictive capacity can describe the present. Only with predictive capacity can it inform investment in the future.

By 2022, the LASWA geoportal was operational. Real-time dashboards. Live jetty monitoring. Passenger data management. Incident reporting workflows. The interface through which officials could see the waterways system in something approximating real time , not through quarterly reports and memory, but through live feeds from an intelligence architecture that was, by this point, several layers deep.
The same year produced something methodologically different: perception surveys and jetty scorecards. The technical work had established where vessels could go and what infrastructure condition looked like. But a transport system does not run on physical viability alone. The question of whether road commuters would shift to water , specifically, what barriers they perceived, what they trusted, what they feared , required demand-side evidence of a kind that no bathymetric chart could provide. The perception studies asked those questions directly. The scorecard initiative named the gaps. A traffic impact study examined 421 roads within 250 metres of 21 jetties, establishing the congestion-relief case for waterways investment not in abstract terms but in route-specific, corridor-level evidence that road planners and transport economists could engage with on their own terms.

By this point, what had begun as a safety monitoring conversation had become something substantially more complex: an accumulating intelligence architecture that spanned physical, operational, institutional, and behavioural dimensions of the same system. It was not a project portfolio. It was a body of knowledge with a structure.
WHAT HYDROGRAPHIC INTELLIGENCE ACTUALLY MEANS
“There is a tendency, in discussions of data-driven urban infrastructure, to treat all data as equivalent, as though the challenge is simply to collect enough of it and coherence follows. The Lagos waterways experience resists this framing at almost every point”
.
Hydrographic intelligence is not a synonym for depth data. It is the integration of at least six distinct knowledge streams, each necessary and none sufficient alone.
The first is bathymetric data: where vessels can physically go. This is the foundation, and its absence was the original failing. But depth charts say nothing about whether routes are used, by whom, under what conditions, or whether the infrastructure supporting them is functional.
The second is route intelligence: the operational reality of specific corridors. Who uses them, at what frequency, with what vessel types, in what weather, carrying what mix of passengers and cargo? The work on the Lekki/Ikoyi Channel, the Lekki Free Trade Zone corridor, and the Ode-Omi connection , pursued in 2023 and extended in the 2024 charting survey , addressed parts of the eastern Lagos waterways network whose economic significance was growing rapidly alongside Lekki's development but whose operational parameters had never been formally documented.

The third is jetty and infrastructure condition data: the asset base that makes routes usable. Terminals are where the route meets the passenger, where vessels are maintained, and where connections to the road network succeed or fail. The node-level condition assessments at Ilaje in Bariga, Ipakodo in Ikorodu, Gbajiyeke and Commando in Badagry , twelve major terminals systematically documented across the network , established a baseline that is indispensable for any investment programme. You cannot plan an upgrade without knowing what you are upgrading from.

The fourth is systems dynamics and predictive modelling: what happens to the system under change. This is the layer most directly connected to the utility of the intelligence architecture for investment planning , it converts evidence about the present into scenarios for the future, and it was the most demanding element of the entire body of work to construct, because it required integrating parameters from every other layer.

The fifth is photogrammetric and digital twin documentation: from data to model to simulation. The 2023 enterprise photogrammetry work for the Waterways Monitoring and Data Management Centre , WMDMC , produced a spatially accurate, operationally parameterised representation of the waterways system in a form that could be visualised, navigated, and updated as the physical system changed. The difference between a GIS layer and a working digital twin is the difference between a map and a simulator.

The sixth is environmental intelligence: the system's sustainability dimension. The 2025 Air Quality Monitoring Plan for Lagos Inland Waterways, covering jetties from Badagry Marina and Igbogbele in the west through Tarkwa Bay on Lagos Island to Offin in Ikorodu and Igbologun in Ojo, tracked sulphur dioxide, nitrogen dioxide, carbon monoxide, ozone, and aerosol index across a network of terminals whose vessel traffic generates emissions that have never been systematically measured. This is not a compliance exercise appended to the main work. A transport modal shift that reduces road congestion while significantly increasing waterborne emissions has not solved the problem it claimed to address. Environmental performance is part of system performance, and measuring it is part of system intelligence.

These six streams interact rather than simply adding up. Bathymetric data informs route intelligence. Route intelligence shapes jetty condition prioritisation. Asset condition data feeds the predictive model. The digital twin updates from both periodic photogrammetric surveys and real-time monitoring. And the environmental layer cuts across all of them, because the feasibility of any expansion must be assessed against its environmental footprint alongside its operational viability. Intelligence that held these streams in isolation would be less than the sum of its parts. The integration logic is, in a genuine sense, where the work lives.
Check out Observatory Earth Analytics on www.oeaconsults.com for their other works.
Enjoyed this?
Get future essays and field notes delivered direct. No spam.
Category
HydrographicsTags
Reading time
10 min
Published
March 21, 2026
More Writing
Browse all articles